Every B2B marketer has faced this challenge:
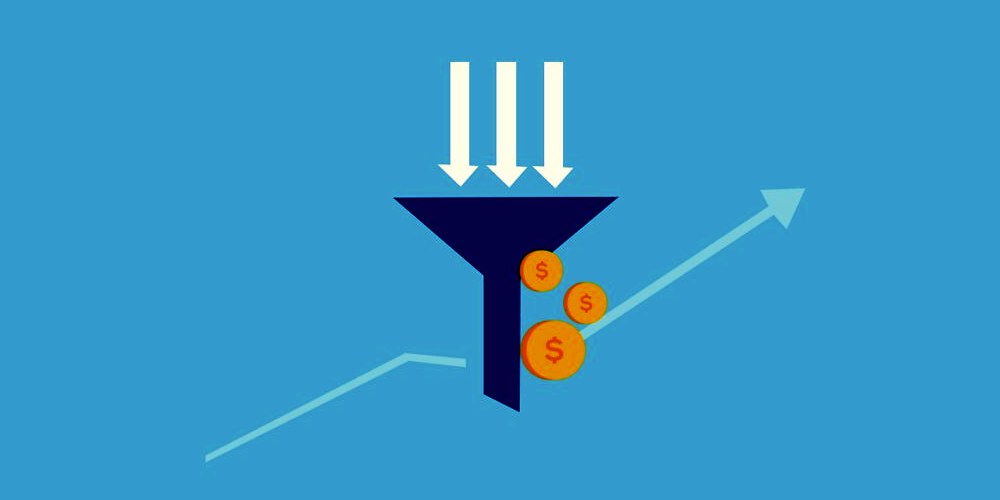
A High number of leads that do not convert!!!!
If you are among them, then you are at the right place. This blog would give you a deeper understanding to increase the sales by dissecting the process, and the metrics for analyzing it.
First, let’s understand what sales metrics are?
It is the key performance indicator that helps to understand the overall performance of the sales process. As a business, it is necessary to gauge the performance regularly so that you can optimize the sales process.
There is no point in running when you are running in the wrong direction!!!
The metrics give you the insights, into the ‘right,’ and the ‘wrong’ direction so that you can fix the errors to achieve excellent results.
The below sales metrics help to understand where you are getting wrong and work on the same to improvise:
Table of Contents
1. Total Number of Sales:
The total number of sales that were produced during a specific time is an important metric.
Every business should fix a specific sales target that one can achieve, like a weekly target, monthly target, etc. This would keep the representatives motivated to pitch the service to the customers at the right time. It has been seen keeping a sales target, improves performance, and increases the total number of sales exponentially.
2. Profit from a Sale:
While the number of sales matters, the profit from a specific sale is one of the essential sales metrics. Businesses cannot witness good revenue only from the number of sales; it also has to fetch them the right profit. This sales metric could accelerate your business results.
3. The number of Opportunities Created:
The number of opportunities created by the sales representative is one of the interesting metrics to measure the performance. As said, sometimes, you have to create opportunities from nowhere to achieve the target. Sales representatives are trained to be always motivated and follow the “creating opportunities” methodology. The number of new opportunities created from little information can be termed as a huge success for the organization, and included to analyze the performance.
Opportunity Win Rate: (Sales Closed/Opportunity)
4. New Sales:
Although existing customers are important, new customers show the potential of your marketing and sales approach. It also helps expand your business and outreach customers across industries and countries. This process needs the right support from the marketing team, as they help promote the service to a broader and unexplored market.
Sales from any new business : (Sales from fresh customers/Total sales) * 100
5. Net Promoter Score:
Net Promoter Score helps to understand how satisfied a customer is with your service. It also tells how loyal the customer would be towards your brand, and recommend your service to others. Just ask how likely they are going to refer your service to their colleagues and friends. With the rating, you can determine the performance of your service. Segregate the feedback, and analyze the numbers such as the good score, average, and bad ones.
NPS= (Percentage of brand advocates) – (Percentage of non-brand advocates)
Brand advocates are the ones who would promote your service, while non-brand advocates are the ones who would not promote the service.
6. Average Lifetime Value of the Customer:
Customer lifetime value is the money earned from a customer as long as he chooses to purchase your product or service.
For example, if he used your service for 5 months, then the money earned from him during 5 months is the lifetime value, if he used it for one year, then the money earned from him within one year is lifetime value. You just need to provide high-quality service to keep it going.
7. Important Interactions:
Meetings, conversations, etc. that lasted for more than four minutes is also a crucial metric. It shows the representative was able to approach the right way to keep the prospect engaged and the conversation going. The metrics help to set a parameter to check the performance of a sales representative.
8. Productivity Metrics:
The productivity metrics are the metrics that measure how much time a salesperson has spent time communicating with the client, and whether it got converted or not. The sales tools used and the amount spend on each of the tools also help to understand productivity.
Productivity = (Number of hours spent calling/Total number of working hours)*100
9. Response time from each of the leads:
When the prospect sends an email, how long the sales representative takes time to contact the lead; it is also one of the metrics to measure the performance of sales. In the current scenario, if you do not contact the lead at the earliest, then the other business might reach out to them and acquire your customer. The response at the right time also shows the dedication to serve the customer.
10. Sales of different Services & Products:
You have to calculate the number of sales of each product or service. You can then analyze which service is popular, and there were more number of sales for the same.
11. Churn rate:
What is the churn rate?
The attrition rate of the customers or the customers wishing to opt-out from your service is called churn rate.
This shows the percentage of customers you are gaining or losing. In this scenario, the representative has to convince the quality of the service or product they provide, so that the customer drop their plan to opt-out and further renew the service. The process requires the best convincing skill of the representative, which inculcates the hope among the customers that they would be provided better service in the future meeting their expectations.
Conclusion:
It has been seen that even if businesses are reaching their target, they still want to improvise their sales to reach the pinnacle of success. The above sales metrics could make their task easier by guiding them on the right path and producing the desired results. They can train their sales representatives based on the metrics and keep a tab on their performance for better output.